

WHY TIME FRAME SELECATION IS
IMPROTANT IN TRADING
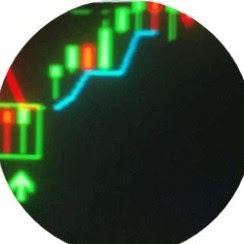
those of you that are not quite sure what I'm talking about here what a time frame means when we trading the financial markets we generally look at charts to see what prices done in the past to give us an idea what prices may do in the future and we'll be looking at charts we know we look at them in three different formats either a candlestick chart which are something like this I'll explain in the moment what they are you've got a line chart which is basically the closing price or you might have a bar chart which will look something like that but in the case of a bar chart on the candlestick chart it's basically the same each candlestick or each bar represents a period of time so for example if we're looking at the daily chart using a candlestick each candlestick represents price action in that particular time period so a candlestick will show us where the market opened where it closed and if it closes higher than mode open it's normally colored blue or green it shows you the high and the low so this candlestick this one candlestick shows us all the price action lots of information in that one day normally runs from New York close 5:00 p.m. New York to 5:00 p.m. the next day but some brokers differ in that so again on the
CANDELSTICK PATTREN AND TIME FRAME
candlestick here you've got open here the low here the close here i should say the low here the high here that's basically the price action in one day but when we're trading looking at charts we don't have to look at just what happened in one day we can drill-down we can drill right down to even one minute we can drill right out to one month if you're looking at one month candlestick that'll basically represent what the highs and the lows were in that month let me explain a little bit further okay so what we've got here on the board for 15-minute candles for this example so this is a 15-minute chart each one of these candles represents price action in that 15 minute time period remember green candles offer closing higher at the mode opened and red candles are closing lower than where it opened so for this example we've opened here we've traded up on this 15 minutes and then indeed we trade it up again on the following 15 minutes hit this high up here okay and then we trade it down and then the final 15 minutes we close back down here so this is price action on each individual 15-minute but you may want to look at just the hourly candlestick here there are 4 15 minutes that can be represented on the hourly chart shows the exactly the same information but not so much detail so for example we've opened here so you'd have them open there basically where the open is here so that would be the open there we've closed lower than where we've opened you see here we've opened and then we've closed lower so it would be a red candle so the closes down here's a cost bomb of that close and of course we had a high up here so this hourly candle here represents the same information that you see on the 15-minute chart but that just shows you more detail so that begs the question do you want to be trading with much more detail or you that bothered about all these individual price swings within that higher time period and so that begs the question which is the best timeframe to use now the answer to this question which timeframe to use is a bit more complex than you may think I'm not simply able to say to you you should be trading the 5 minute or the 1 hour or the daily ones more profitable than the other because that's just not the case the reason why it's not the case is because everyone's personal circumstances and objectives are different you may have a day job and you may have only limited amount of time to Bend in front of the screens maybe less than an hour a day in which case you know you're looking to be trading maybe off the higher time peerage maybe in the daily or the monthly remember when you're trading off the daily or their monthly the amount of trade you take over the course of the month will be a lot less there'll be few and far between on the other hand you may have plenty of hours throughout the day to spend in front of the screens looking for those opportunities you therefore may be able to take five ten fifteen twenty trades a day often referred to of course as scalping so you're looking to exploit your trading edge over a large number of trades you might be looking at the 5-minute the 50 min or the hourly chart now what are your objectives very very important you may be looking to grow an account over a long period of time to pay for retirement perhaps or your school fees in which case you may want to avoid all this noise of the lower time pues so you be looking at the weekly and the monthly time poets of course the trade will be few and far between but you're looking to do this over a longer period of time now you may look to trade full-time to get a monthly income in which case you need to make regular profits on a monthly basis in which case you might be trading the smaller or shorter time periods like the one hour the fifteen minutes and so forth grinding out your edge over multiple trades taking a monthly income so the four hours is a one hour and fifteen minute might be preferred the one thing that all these objectives have in common is the desire to make money right that's why we're here but for me the deciding factor on which time frame to use comes down to one factor and that's the psychology side of trading now we all know that psychology plays a huge part in trading and quite frankly it's the bad psychology that's the killer of most trading accounts now trading the really short timeframes buying and selling off the 15 minute the 5 minutes the 1 minute time period can be very emotional seeing money go in and out of the account is emotional and money is an emotional commodity there's lots of noise down there and sometimes you can get caught up in all this noise so I strongly suggest if you're new to trading leave all that noise to the more experienced trader I mean trading after all has its own challenges so don't make it even more challenging by increasing your emotional involvement on the shorter time poets so take a step back and trade off the high time poets the 4-hour or the daily sure it's not going to be as exciting is a five-minute chart but honestly if you're looking for excitement you're gonna be far better off going to say the horses or something like that and losing your money at least then you're gonna be with your friends having a good time far better than sitting at home on your laptop once you've proved yourself and your skills as a trader then and only then should you be looking to trade the lower time peers this is purely my opinion and finally of course you've got to consider the actual strategy itself now here signals calm we talked about and trade live very strategies from the swing trading day strategy down to the five-minute scalping strategy we've got strategies for all conditions and all levels of trade up so make sure you check those out if you haven't already done so but make sure the strategy are using is optimized for that particular time period so Clive and pips wait I hope I've gotten somebody to answer your questions today Clive you're struggling on the 5 15 minute I suggested drill back up go back to the daily see how you get on there stop bleeding money from the account I'm sure you'll find that worth while endeavour and pips await your new trading so welcome to the room I suggest you start by looking at the daily see how you get on there and then we can discuss moving down to the intraday time periods should you have

.png)

0 Comments