
LEARN ABOUT SUPPORT LEVEL IN FOREX TRADING

In this article you will learn simple shooting star candle stick pattern strategy. The shooting star is basically a sell signal and if the trend is up and we see the shooting star it means the market trend has changed now. I'll tell you about an easy strategy
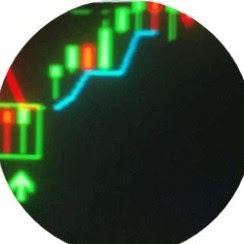
look at the picture below

The white line shows the level of resistance. You see the green shooting star on the resistance level. And the second candle stick is a barish candle stick with a sailing momentum. When you see the same interface on your Forex market chart, you trade sales and raise your stop loss above the resistance level and above the shooting star.
What Is Support Level?
we're going to talk about support and resistance levels.
look at the picture below.

so support levels let's imagine a situation where we have a downward trend in the market and in this case a support level is a horizontal line which is called support level which represents a barrier for the price so when we'll find out how to look for support levels in a few minutes but right now let's see what a support level does to the price so as the price approaches the support level traders become hesitant because they don't know what will happen they don't know whether the price will cross it or whether the price will bounce off and move in the opposite direction so generally you'll notice a kind of consolidation on the market and then one of the following three things will happen either the price will bounce off the support level and go in the opposite direction or the price might test the support level a little bit cross it and then bounce off and go in the opposite direction or the price can actually cross the support level and there will be a massive impulse in the direction of the trend so now resistance levels they're very similar but they're the opposite they're above price so resistance level puts pressure on the price and doesn't and acts as a barrier for the price going upwards and once again generally speaking there's three possible outcomes either the price bounces off the resistance level and goes down or it can test the resistance level and then go down or it can cross the resistance level and there'll be a strong impulse in the direction of the trend there are two main types of support and resistance levels and these are historical and psychological let's have a look at the historical type first so historical levels looking at this chart can you identify any horizontal lines that have been tried and tested by the price more than one time we can see one of those lines right away it's this horizontal support line and the price tested this line over here at first and then it came back to this line here and so what can we anticipate from uh the prices future movement well we can anticipate that if the price does go towards this support line then something will probably happen over there so and that's how you establish support and resistance levels the historical type you look at what happened in the past and you see that oh wait a second so the price was hesitant to cross this level previously or there was some sort of consolidation there in the past so maybe that same thing or something might happen when the price approaches this level and more often than not that's exactly what will happen there will be some sort of abnormal movement when the price gets to this level and that's what uh we take advantage of the second type is psychological levels so they're a bit different in the sense that the price is just uh in a trend and um then we identify a level which is very often round number so for example 1.500 that is a number that's plays with the minds of traders and because they don't know whether the price is going to bounce off it or cross it mathematically

.png)

)
0 Comments